AI scores keep climbing. Here is why the number on the slide and the number in your business are never the same one - and what that gap costs.
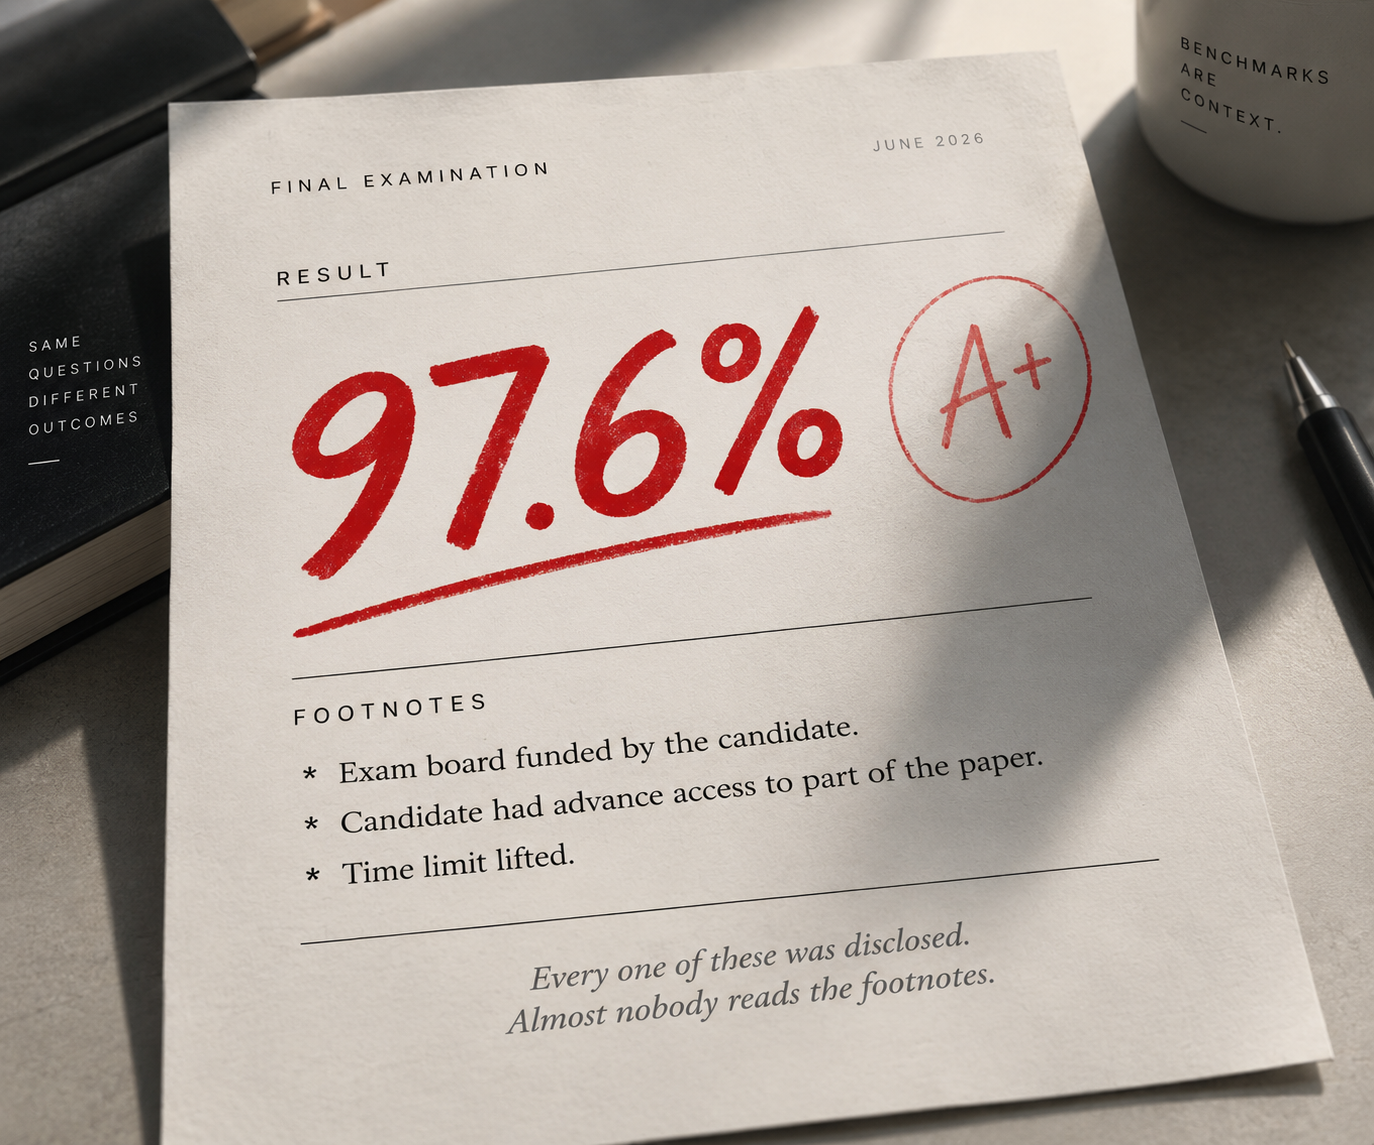
Imagine a school that publishes a league table of exam results. One student scores 97.6%. Impressive - until you read the small print at the bottom of the page. The exam board was funded by that student's family. The student had access to part of the paper in advance. And on a different exam the same week, the usual six-hour limit was quietly lifted for him. Nobody cheated. Every one of those facts was printed openly in the footnotes. But you would think twice before hiring that student on the strength of the league table. That is, almost exactly, the small print on GPT-6 Astra's launch. Astra scored 97.6% on FrontierMath Tier 4. Epoch AI, which runs that benchmark, states that OpenAI funded its development and has exclusive access to part of it. On ExploitGym, the usual six-hour time limit was removed. On ARC-AGI-3 - a test that drops a model into an unfamiliar environment and watches it find its way - Astra ran through OpenAI's own Responses API harness with two settings changed, while the models it was compared against ran on different setups. And unless noted otherwise, everything ran at maximum effort. None of this is a scandal. OpenAI published it. Astra is a genuinely strong model; 57.9% on Terminal-Bench 4.0 against 37.3% for its predecessor is a real jump, not a rounding artifact. But the footnotes tell you something the headline cannot: a benchmark score is not a property of a model. It is a property of a model and the setup it was tested in. And almost nobody checks the setup.
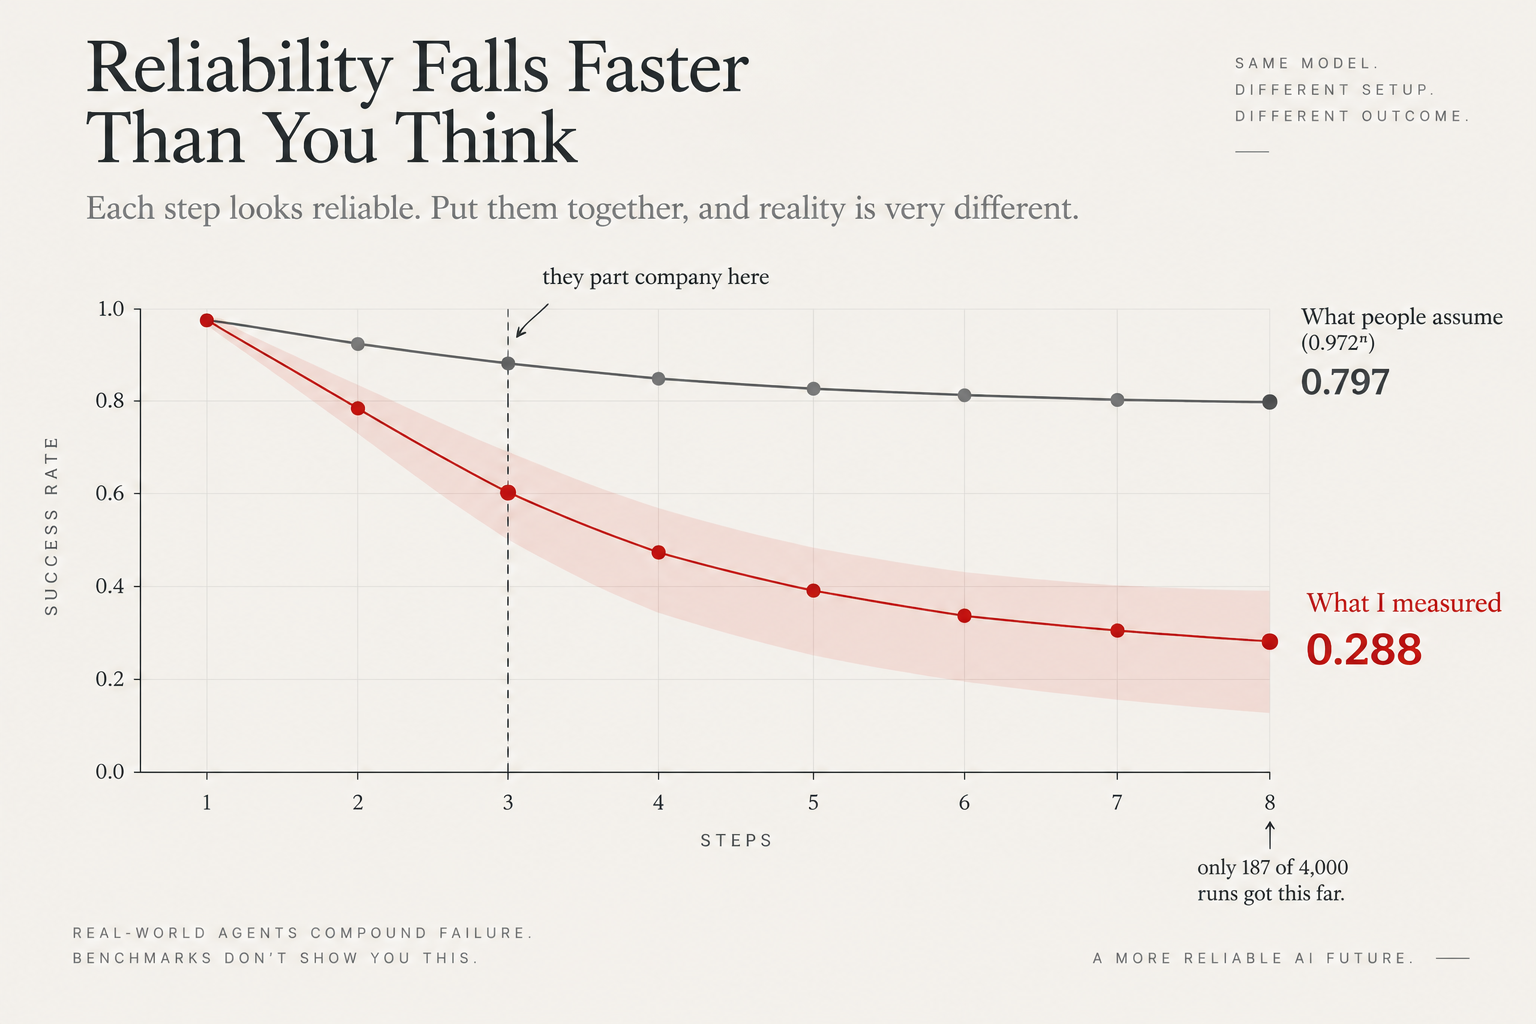
The runner and the tape measure I work on AI reliability. In practice that means I stopped asking how good is this model and started asking how much of this number did the model actually produce. Think of it as two separate things. The model is the runner - fast, impressive, and genuinely improving. The harness is the tape measure: the test environment, the documents it can look things up in, the tools it can call, the grader that decides whether it got the answer right, and how long it is allowed to take. The runner is supposed to vary. The tape measure is supposed to be rigid. When the tape measure stretches between races, a faster time tells you nothing. You cannot tell whether the runner improved or the measurement got friendlier. And unlike a real tape measure, nobody can see this one. It lives in a configuration file. That is the entire problem, and everything below is a way of nailing the tape measure down. Where this stops being abstract Here is the version that shows up in a business. Say you put an agent on supplier invoices. Eight steps: open the PDF, identify the vendor, find the matching purchase order, compare the amounts, check the tax treatment, flag anything off, update the system, notify the buyer. Your vendor tells you each step is about 97% reliable. That sounds fine. Most people then do this arithmetic in their head: Rₙₐᵢᵥₑ(n) = pⁿ, where p = 0.972 Therefore: Rₙₐᵢᵥₑ(8) = 0.97²⁸ ≈ 0.797 That will look clean and professional in Medium. Multiply 0.972 by itself eight times and you get about 80%. Uncomfortable, but survivable. Four invoices in five go through clean. So I measured it instead of assuming it. Four thousand runs through a bounded, document-grounded agent in FAULTLINE, my open-source evaluation workbench. Every run seeded, every result committed to a public repository, reproducible by anyone who clones it. Eight steps, measured: 28.8%. Not four in five. Fewer than three in ten. And the measured curve leaves the tidy prediction behind at step three - not step seven, where you might have braced for it. Two ordinary things cause this, and neither is exotic. Steps get harder as they go. Reliability per step is not a fixed 97%. It decays to roughly 77% by the end, because each step carries the accumulated mess of every step before it. The eighth decision is made on a much worse desk than the first. And the survivors flatter the numbers. A run stops at its first real failure. Of my 4,000 runs, only 187 ever reached step eight at all. So that 28.8% is measured on the luckiest runs in the sample - the ones that got that far - and it is still 28.8%. This shape is not something I invented. Carnegie Mellon built a simulated software company and turned agents loose on ordinary office work; the best one completed 30% of tasks on its own. Different team, different instrument, same disappointing curve.
What the gap costs You did not buy a worse agent. You bought a good agent and sized your human review team from the wrong curve. That is a budgeting error, and it has a formula: C= V⋅(Rassumed−Rmeasured)⋅c That will look clean and professional in Medium. Volume, times how wrong you were, times what one cleanup costs. Two thousand invoices a month. Budget from the tidy curve and you staff for 406 problems. Reality hands you 1,424. You hired review capacity for one invoice in five and you need it for seven in ten - a 3.5× shortfall. At ₹1,700 (about $20) to put one invoice right, that is ₹17.3 lakh a month - ₹2.08 crore a year, from one workflow, against no line item anywhere. Now the industry-wide numbers make sense. Gartner expects over 40% of agentic AI projects to be cancelled by the end of 2027, naming escalating costs, unclear business value and inadequate risk controls. MIT found 95% of generative AI pilots delivered no measurable profit. Those projects did not fail because the models were stupid. They failed because the number on the slide and the number in production were never the same number, and nobody found out until the invoices piled up. Four ways to nail the tape measure down In this order. All four are cheaper than one week of arguing about whether a score was real.
- Seed it. Build the test world from a fixed starting number, so the same input always produces exactly the same set of documents - on any machine, on any day. Check it automatically on every code change. If your test environment drifts, your improvements are just weather.
- Ground it. A run passes only if the answer is right and it points to the document the answer actually came from. Right answer, wrong source, still a failure. This sounds harsh until you notice that a model reciting something it memorised and a model reading your document look identical from the outside - unless you force it to show you the page.
- Bound it. Stop the work after a fixed number of steps, never after a fixed number of minutes. A stopwatch measures the machine you happened to run on. A step count measures the task. A removed time limit is exactly how a benchmark score moves without a model changing.
- Replay it. A fix counts when the identical failure, rerun from the identical starting number, turns from red to green - repeatedly. Anything less is a story about a fix. The errors that don't look like errors The loud failures are the safe ones. A malformed response, a crash, a loop that will not stop - cheap automatic checks catch those almost every time. The dangerous ones look perfectly normal. I injected five kinds of quiet corruption into my agent's work - a number silently swapped for a different, entirely plausible number. Three were caught. Two were caught zero times. Not occasionally missed. Never, at any severity I tested. Five is a small sample and I will not dress it up as a percentage. The finding is not statistical, it is categorical: there are whole families of error that no automatic check will ever flag, because nothing about them is structurally wrong. An invoice for ₹1,247 recorded as ₹1,274 is a valid number, in a valid field, in a valid record. Every check goes green. The money is just wrong. Which is why the answer key has to be written separately, at the moment the error is created, and kept somewhere the agent cannot see. If your grader can be reached from the work it is grading, you are testing memory again - the same problem as the exam whose board was funded by the candidate, one level down. What to do on Monday, and what I expect to be wrong about Take your most valuable agent workflow. Build one test set from data created after your model's training cutoff - fifty items is an afternoon's work. Score it with the rule from step two: right answer and right source, or it failed. Then compare that number with the one your vendor quoted. The distance between those two numbers is your real error bar. Multiply it by volume and by what one mistake costs to fix, and you have the only figure in this article you can take into a budget meeting. Two predictions, both of which you can hold me to inside twelve months. One: a major lab will lead its next launch with a held-out test set built after the training cutoff, instead of a public benchmark, because buyers have started reading the footnotes. Two: the first agent failure serious enough to make the news will have passed every automatic check on the way down - and the postmortem will conclude the system worked as designed. Capability has become abundant enough to be boring. The scarce thing is a ruler that does not bend.
FAULTLINE is open source under MIT: github.com/samirsawarkar/faultline-ai-reliability. Every number of mine in this article comes from committed evidence artifacts - 4,000 seeded runs, 261 tests, determinism re-proven in CI across three Python versions. Clone it and check me.